Introduction
The analysis framework in AViS is graph-based, where a collection of function is applied to the system, each containing an arbitrary number of input and output variables.
Terminology
In AViS, each function is called a node, each input/output connection is called a socket,
and a network of connected nodes is called a graph. The implementation of a node can be built-in,
or extended via C++ / Python / Fortran scripts.
Coloring
Default (extended) nodes are colored grey. These nodes are considered pure functions, and they should only operate on data from input and output sockets.
I/O nodes are colored green. These nodes read from or write to existing data in the scene. An example of which is the
Particle Data node.
Modifier nodes are colored blue. These nodes create new data or visualizations, such as the Add Bonds node.
Special nodes that have unique operations are colored red, such as the Plot Graph node.
Designing a graph
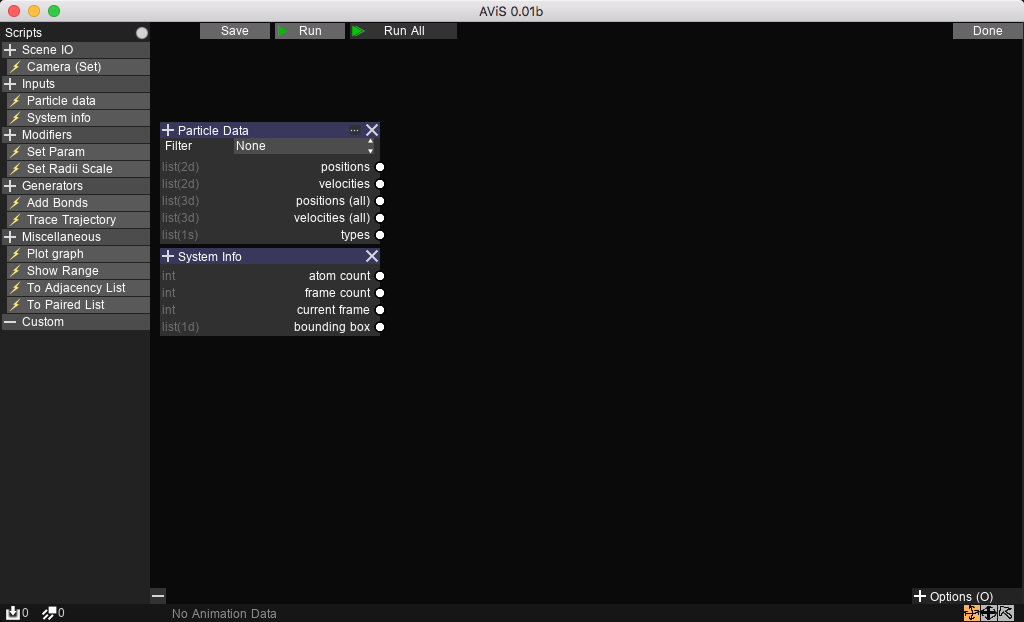
The graph editor can be accessed using the Edit button on the top right of the Analysis tab.
The default view should have 2 nodes already added, the Particle Data and System Info nodes.
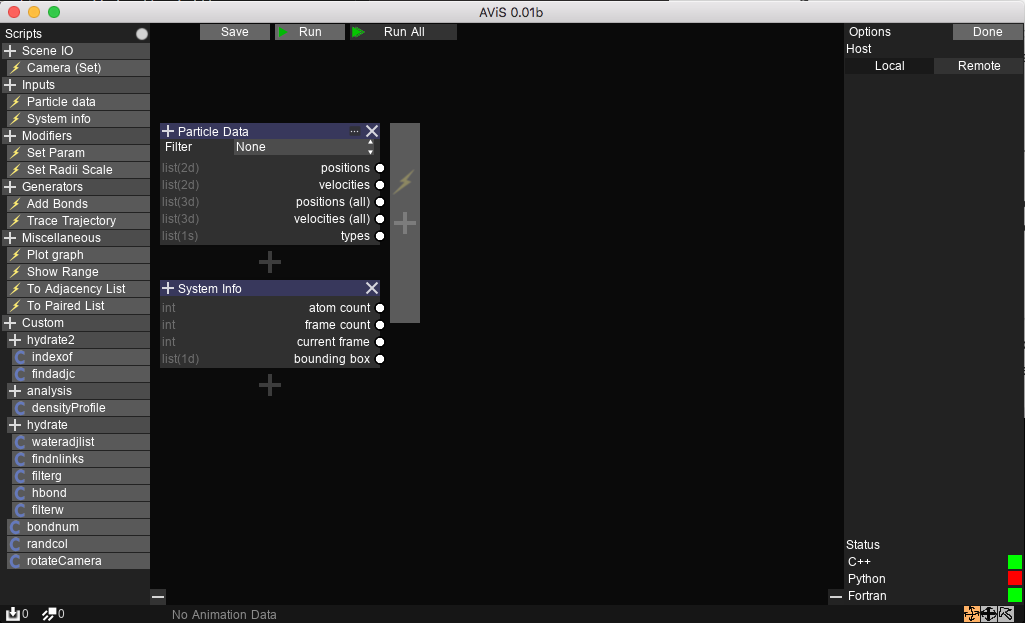
New nodes can be added by first selecting a node from the Nodes tab.
Then, the node can be added to anywhere highlighted with a + sign.
Nodes can be removed with the X button.
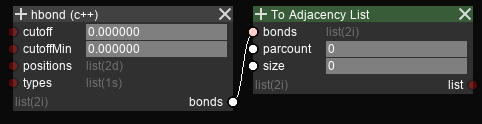
Connections between nodes can be made by clicking on both input and output sockets of the connection.
A connection cannot be recursive (a node can only take data from nodes which execute before it).
However, you can store temporary output on an attribute node and read from it in the next execution.
An output socket can be connected to multiple input sockets.
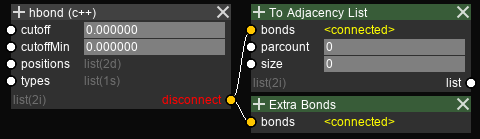
A connection can be removed by hovering over the name of the socket, and clicking on the disconnect button.
Disconnecting an socket removes all connections from/to that socket.
Execution
Nodes are evaluated top-to-bottom, left-to-right. When executed with Run, the graph is evaluated on data from the current visible snapshot frame.
When executed with Run all, the graph is evaluated total frame count times for the whole trajectory, and the data is cached for playback;
That is, when the trajectory is played back, the values of all intermediate calculations for each visible frame can be inspected from the UI.
Note
When executed with Run, all data from the previous Run All is discarded.