Density Profile
The density profile node shows the number density for each atom type. You can choose which axis to calculate the density.
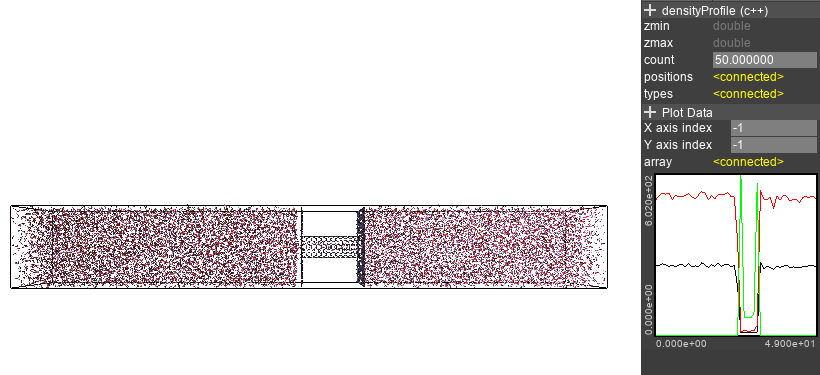
The count parameter controls how many slices to calculate the density profile.
Larger values gives a more detailed graph, but with more noise.
The density of each type has a different index in the 2nd axis,
so the density profile for a single type can be specified with the Y axis index of the Plotter.
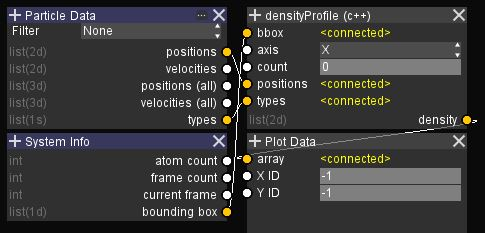
The graph setup is as follows.
Source code (Error checking omitted):
#include <iostream>
#include <cmath>
#include <vector>
#include <unordered_map>

//@in 6
double* bbox = 0;
//@in enum X Y Z
int axis = 0;
//@in
int count = 0;
//@in parcnt 3
double* positions = 0;
//@in parcnt
short* types = 0;

//@out count typecnt
double* density = 0;

//@var
int parcnt = 0;
//@var
int typecnt = 0;

//@entry
void Do () {
    double zmin = bbox[axis*2];
    double zmax = bbox[axis*2+1];
    double vol = (bbox[1]-bbox[0])*(bbox[3]-bbox[2])*(bbox[5]-bbox[4]) / count;
    double dd = 1/vol;
    std::unordered_map<short, std::vector<double>> dens;
    for (int a = 0; a < parcnt; a++) {
        auto z = (positions[a*3 + axis] - zmin)/(zmax-zmin);
        auto i = (int)floor(z*count);
        if (i < count) {
            short tp = types[a];
            dens[tp].resize(count);
            dens[tp][i] += dd;
        }
    }
    typecnt = (int)dens.size();
    if (density) delete[](density);
    density = new double[count * typecnt];
    int a = 0;
    for (auto& d : dens) {
        for (int x = 0; x < count; x++)
            density[x*typecnt + a] = d.second[x];
        a++;
    }
}